Wood fires and particulates: where my pollution spikes came from
Ever since I started measuring air quality at home, I kept seeing particulate spikes I couldn’t account for. They didn’t last, they came back with no obvious pattern, and I couldn’t see what might be causing them. I eventually formed a hypothesis, and set about testing it.
The idea came from Chiang Mai
A trip to northern Thailand put me on the trail. In Chiang Mai I’d seen very high particulate levels, caused by field burning — everyone burns their agricultural waste at the same time, and the mountains hold the air in place. The particles don’t disperse into the atmosphere fast enough, and levels easily go past 200.
If open fires can do that on the scale of a valley, I thought, a chimney must be doing something on the scale of a garden.
The setup
My air quality sensor is an Airlink from Davis Instruments, fixed to the terrace balustrade. It continuously measures PM1, PM2.5 and PM10, and sends the data both to my weather site and to weatherlink.com. It’s a module I added to my Vantage Pro 2 weather station.
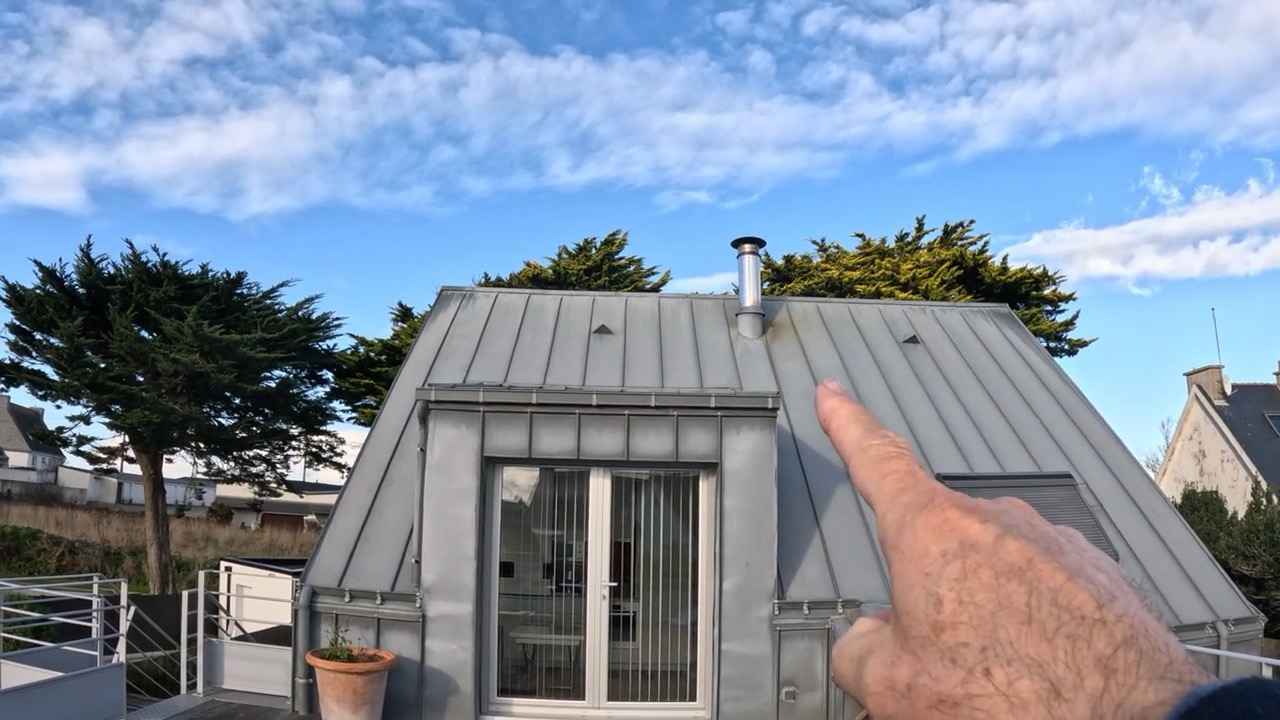
From that terrace you get a clear view of the chimney outlet on the roof. Between the two there are about fifteen metres, plus the height of the roof. Close, without being right up against it — and above all, we’re outdoors, with wind and everything that comes with it.
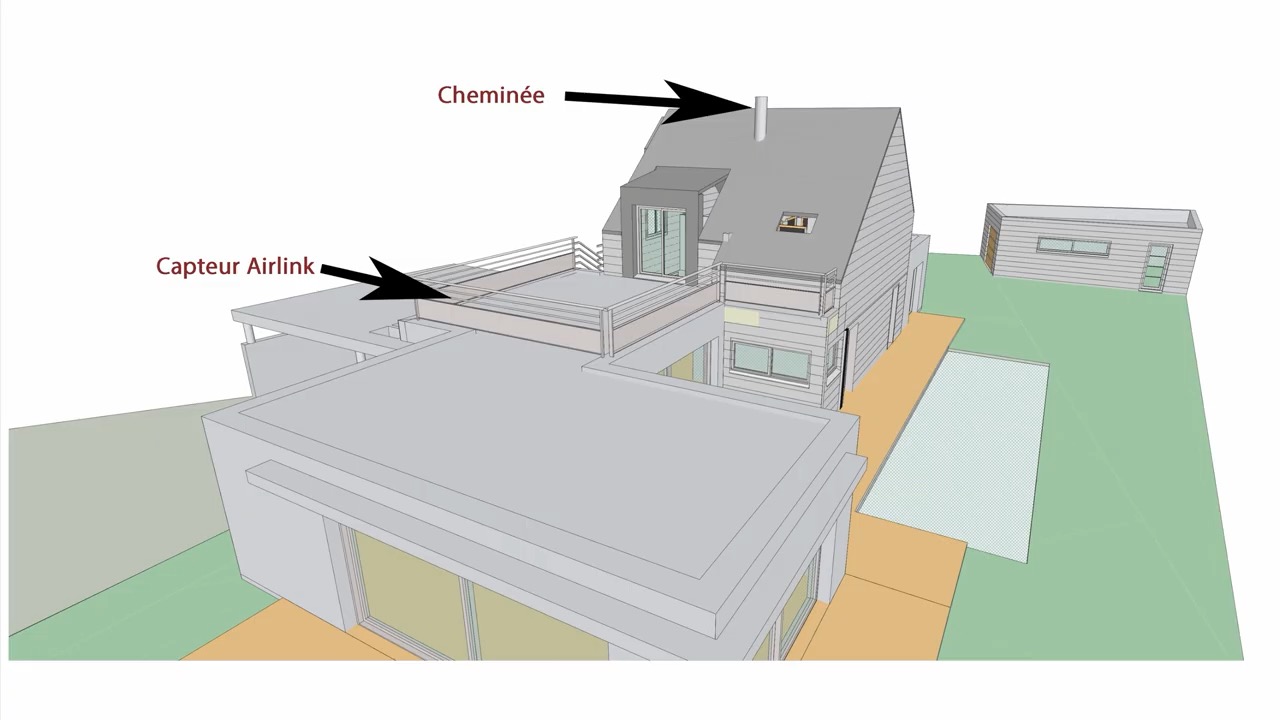
The geometry of the test: the chimney outlet on the roof, the Airlink sensor on the terrace balustrade.
The test, 19 November
18:47, dark outside, 4.3 °C. I note the levels before lighting anything, then make an ordinary fire with firelighters in my hearth — a double-combustion Ruegg, whose draw has always worked very well. I leave the glass open by about a finger’s width while it catches.
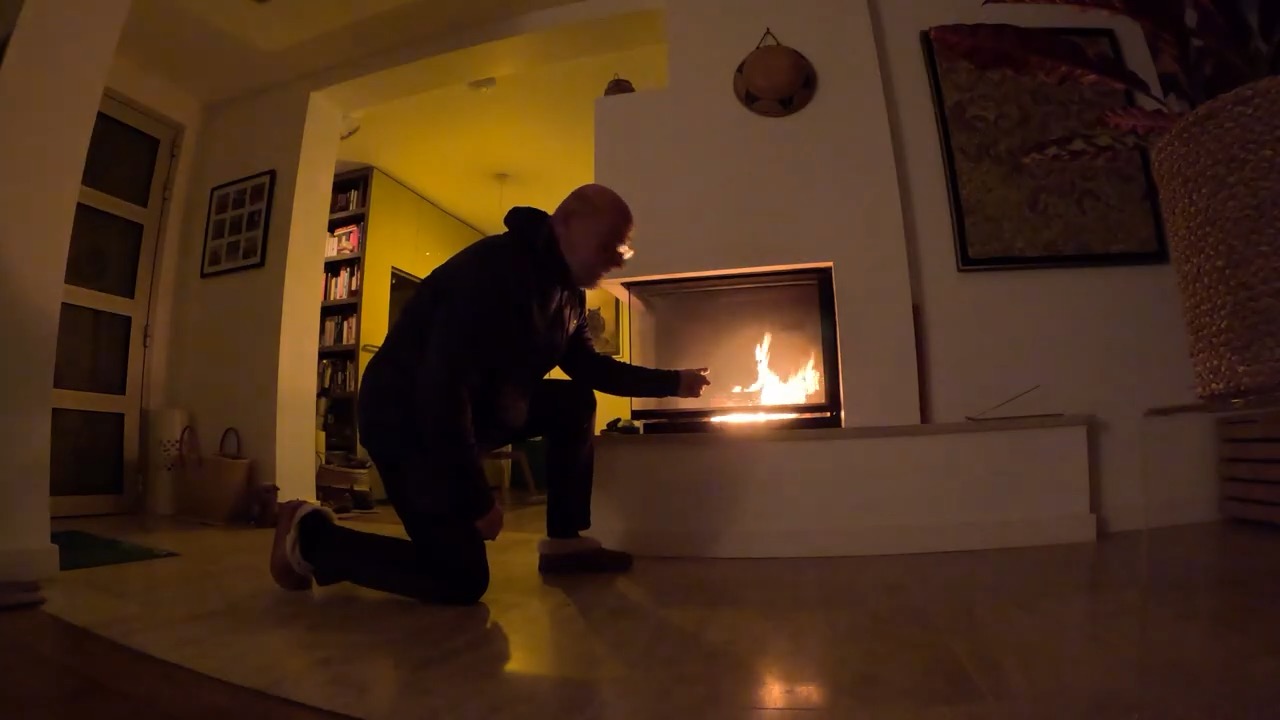
18:51, lighting up. The double-combustion Ruegg hearth, glass left ajar while it catches.
Then I go back up to the computer. Eight minutes separate the two readings, and the fire has been burning for less than five.
The effect is immediate:
| Before (18:48) | After (18:56) | |
|---|---|---|
| PM1 | 1 µg/m³ | 51 µg/m³ |
| PM2.5 | 2 µg/m³ | 100 µg/m³ |
| PM10 | 3 µg/m³ | 117 µg/m³ |
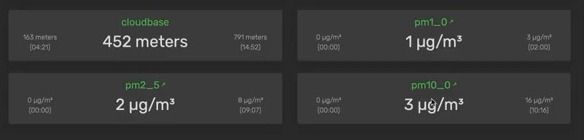
Before lighting.
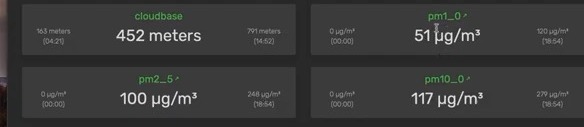
Eight minutes later. Only the particulate figures have moved — the cloud base is unchanged.
On weatherlink.com the same data arrives slightly later — 46, 85, 95 — the time it takes to consolidate. But the trend is clear either way.
A chimney fire, fifteen metres away and in the open air, shows up immediately on a particulate sensor.
And indoors?
Once the fire has taken properly, we raise the glass: by convection, you get considerably more heat out of it. That was the chance to check the other half of the question — do particles get into the room?
I have a second sensor indoors, near the office. After a good quarter of an hour with the glass up: nothing. No rise at all. The smoke goes up the flue and doesn’t spread into the room.
It’s worth being honest about the limits of that observation: my indoor sensor sits some distance from the hearth, and I might have seen something by moving it closer. But as things stand, the hearth is doing exactly its job.
The next day’s graphs
It’s looking at the graphs the following day that makes the result really speak. The three curves — PM1, PM2.5 and PM10 — have near-identical shapes and rise together. It isn’t only the 2.5s reacting, it’s the whole range.
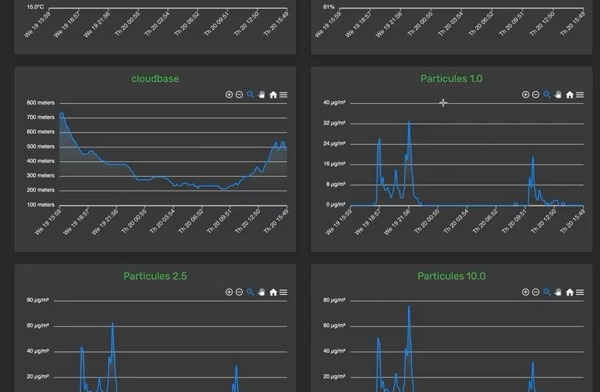
The three particulate curves on my own site: same shapes, same spikes, at the same times.
And above all, you can read three spikes matching three precise moments:
- 18:59 the previous evening — my test, filmed;
- around 22:00, when I reloaded the hearth with wood and got the fire going again;
- 10:39 the next morning, when I made a fire for visitors.
Each time, the same signature: a sharp rise at lighting, then a quick fall. Fifteen to twenty minutes after the fire started, it had already dropped back. The same spikes show up on WeatherLink, overlaid on a single graph.

On WeatherLink, the three levels overlaid. The tooltip shows the 22:00 reading, the moment I reloaded the hearth. On the left of the toolbar, the ‘Wood Smoke Adjustment’ option, which I leave unticked.
An option I don’t switch on
In the WeatherLink toolbar there’s a checkbox labelled Wood Smoke Adjustment. It deserves an explanation, because it bears directly on the subject of this article.
The option corrects the air quality index — not the particulate measurements themselves. Standard algorithms, such as the US Environmental Protection Agency’s NowCast, calculate the AQI from PM2.5 concentration without distinguishing where the particles came from. Wood smoke tends to make the apparent danger look overstated compared with more toxic particles. So the option applies a correction factor that slightly lowers the displayed index.
Davis recommends switching it on when wood fires really are what’s affecting your readings — neighbourhood chimneys, campfires, vegetation fires. And emphatically not for industrial smoke or burning synthetic materials, in a house fire for instance: those contain components that warrant no easing of the displayed risk at all.
I have never switched it on. I wanted to see the raw data, not corrected data. It makes no difference to anything above: the figures I give here are the sensor’s measurements, not a recalculated index.
Why public stations don’t show these spikes
That also explains something I’d noticed when comparing my readings with the public stations in my region: on theirs, a spike like mine never shows up as such.
My station reports particulates in real time, minute by minute. Public indices are calculated on rolling averages — up to twelve hours for the American NowCast, the hour or the day for European indices. A twenty-minute rise all but dissolves in that.
You could see this as regrettable smoothing. I think it’s mostly consistent with what those indices are trying to say. The AQI isn’t a concentration measurement, it’s an indicator of health risk — and for particulates, risk depends on how long you’re exposed as much as on the level reached. My 100 µg/m³ for twenty minutes doesn’t mean the same thing as 100 µg/m³ for three days. Publishing the instantaneous value would give a spectacular figure and, in this case, a misleading one.
That is exactly what my test shows: the shape matters as much as the amplitude. It remains true that to understand what’s happening at your own house, the raw data is irreplaceable. Which is precisely why I keep it.
What I take from it
First, the mystery is solved. Those spikes I couldn’t understand are chimneys — mine, and the neighbours’. It was as simple as that.
Second, the shape of the phenomenon matters as much as its size. These are brief spikes, not a plateau. The emission happens at lighting, while the wood isn’t yet up to temperature; once the hearth is hot and the double combustion is running, it falls away.
And that is exactly what separates my garden from Chiang Mai. There it isn’t a twenty-minute spike, it’s a plateau lasting weeks, sustained by thousands of fires and trapped by the terrain. The same mechanism, on a completely different scale and, above all, over a completely different span of time.
It also makes you think about what people breathed in when they spent their evenings by the fire, in open hearths with none of what we have today. They must have taken in a fair amount.
I’m not claiming to have proved causation — it may be a correlation. But I light a fire, and the particulates rise within minutes, three times over, at three different moments. What interested me here wasn’t reassuring myself or worrying myself: it was understanding something I’d been observing without being able to explain. I think that’s done.
What happened next
We have since sold the house, and the weather station stayed with it, the Airlink along with it. I didn’t have the heart to dismantle the whole thing — and it is all well installed.
What remains usable as it stands is the simple part: the latest-generation console in the kitchen displays the station’s readings live. Nothing to configure, nothing to maintain.
The technical layer, on the other hand, I decommissioned entirely — there seemed no point at all in passing it on:
- the WeatherLink Live box, redundant with the console;
- my weatherlink.com accounts — the buyer is free to register and subscribe if they want to;
- the garage console and the Raspberry Pi 5 connected to it, running WeeWX;
- the web access to the WeeWX station, along with the No-IP DDNS entries pointing at that site.
It’s a distinction worth drawing when you sell an equipped house: what passes on easily is what works without intervention. Anything requiring maintenance, a subscription or technical knowledge makes little sense to leave behind — it would quickly become a fault the new owner had no way of fixing.