Presenting and installing my Vantage Pro 2 weather station
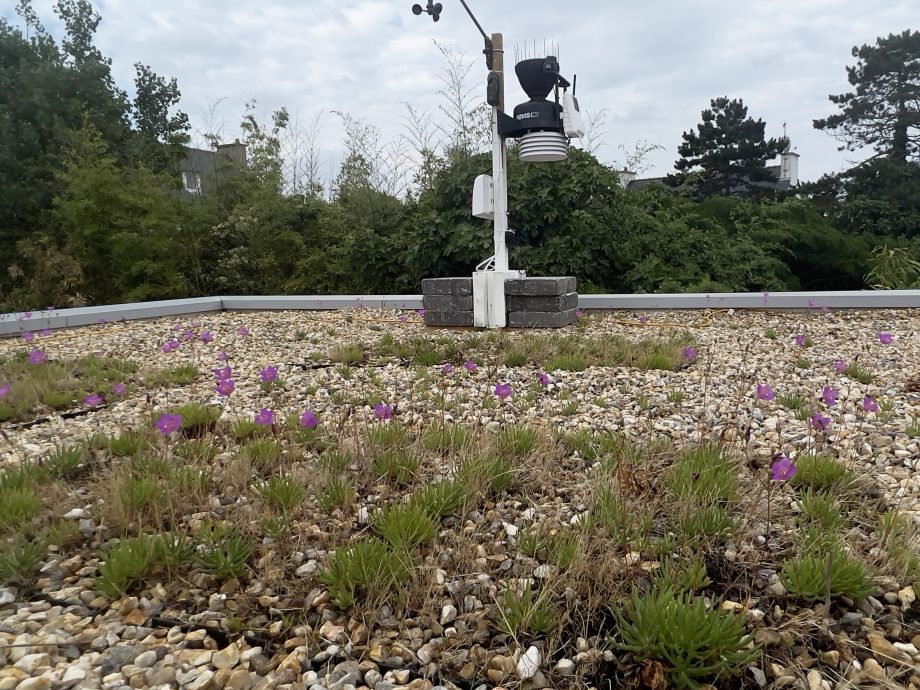
My weather station has now been running on my flat roof deck in Kerroch for 3 years. A good excuse to go back to basics: what’s actually inside a Davis Instruments Vantage Pro 2, how the data makes its way up to the Weatherlink cloud, how I mounted it, and what the web and iPhone apps look like once everything’s wired up. For the details of my local WeeWX setup and the Belchertown skin, see Weather observations with the Vantage Pro 2 station — here I’m focusing on the general presentation and the installation itself.
What’s inside the unit
The station is called the Vantage Pro 2, made by Davis Instruments (an American company). It’s built around a module called the ISS (Integrated Sensor Suite): an anemometer mounted on a small mast, giving wind direction and speed, plus a housing that groups the rain gauge, the temperature and humidity sensors, and an electronics compartment with a small solar panel for power. No electrical cable needed at all — it runs purely on solar power, with batteries as backup.
The ISS communicates by radio, on the roughly 868 MHz band, via a built-in antenna. In the base configuration you get four measurements: wind, rain, temperature, humidity. You can then add two small add-on modules that clip onto the top of the unit: a UV sensor and a solar-radiation sensor (in W/m²) — which is what I did.
Console, WeatherLink Live and the cloud: how the data gets uploaded
The station is useless on its own: you also need a way to capture and store the data. So it’s sold bundled with a console. There are two generations: the old one, with lots of buttons and an external antenna, and a newer, more modern version with the antenna built in. Both receive data from the ISS the same way and display it live — temperature, wind, rain, pressure — with a small indicator that blinks on every reception (roughly every 2 to 5 seconds).
On top of that, I also have the WeatherLink Live: a very simple box, powered by a mains adapter, connected via Ethernet (or WiFi), whose only job is to pick up the ISS data continuously and send it to Davis Instruments’ cloud, at weatherlink.com. This is the module that lets you check your data remotely without relying on a computer being on all the time.
From there, two paths are possible:
- The cloud: the console or the WeatherLink Live send everything to weatherlink.com, and you then check it via the website or the app. This is the simplest solution to set up.
- Local storage: with the old console, you can plug a USB data logger into a PC. The Windows software Davis provides for this is honestly outdated — I tried it, and between driver issues and an interface from another era, I think it’s best forgotten. The good local solution is WeeWX, a very well-made open-source piece of software (written in Python by American developer Tom Keffer), which I ended up installing on a Raspberry Pi — I go into detail on that in the dedicated article.
On top of that, there’s a third piece of Davis Instruments kit I also have: the Airlink, an air-quality module (PM1, PM2.5 and PM10 particles), which connects over WiFi and also uploads its data to weatherlink.com, alongside the weather data.
History and budget
- March 2022: bought the Vantage Pro 2 bundle (station + console + WeatherLink Live) from Météo Shopping, for around €900.
- March 2022, at the same time: bought the USB data logger (€180) to try the local PC-based solution — abandoned fairly quickly, as explained above.
- April 2022: added the Airlink module for air quality, €190.
- Late 2023 / early 2024: discovered WeeWX, installed it on a Raspberry Pi, first on a plain SD card, then consolidated onto a 130GB SSD — plenty, given how small each record is despite a very high measurement rate (the ISS transmits roughly every 2.5 seconds).
- More recently: added the Belchertown skin for a nicer web presentation of the data.
That’s just over €1,270 of Davis Instruments hardware to date. Not cheap, but after 3 years of trouble-free use, I think it’s justified.
The installation: a mount that hasn’t moved in 3 years
I installed the station on my flat roof deck, on a wooden base I built myself and weighted down with concrete pavers, with a wooden structure under the gravel to spread the load properly. Three years, several storms and gusts later (we easily get 80 km/h winds here in winter), and nothing has moved.
A few practical points from the installation:
- Orientation: due south, with no trees or shading nearby — important for the ISS’s small solar panel.
- Height: the manual recommends about 1.5m off the ground for the anemometer; mine sits a bit below that relative to my deck, but counting from the garden below, it’s more like 4m up.
- Radio range: Davis advertises up to 100m for the 868 MHz link; at my place the actual distance is more like 40m, through a concrete slab, without a single reception issue in 3 years.
- Mounting: nothing too complicated. The wooden post was a bit too square for the mounting collar, so I had to plane it down slightly to round it off. The supplied anti-bird spikes clip easily onto the rain gauge.
- Maintenance: pretty much the only real thing to watch is the rain gauge — moss and debris (small leaf fragments) can build up and skew the reading by slowing the water flow. Regular cleaning is enough; the rain-gauge cup comes apart easily.
Indoors, the equipment is spread across three rooms: in the garage, the old console with its USB data logger, connected to the Raspberry Pi running WeeWX; in the living room, the WeatherLink Live, wired via Ethernet; in the kitchen, the new Weatherlink console, which directly displays air quality (Airlink) — a real plus compared with the old console, which doesn’t show it.
Weatherlink.com and the iPhone app
Once the station is registered on weatherlink.com (a free account to start), you get all the live data: wind (speed, gusts, compass direction), indoor and outdoor temperature, humidity, pressure, cumulative rainfall, UV index, solar radiation, and air quality if the Airlink is registered. The interface is customisable: you choose which modules to show and in what order.
The graphs are one of the site’s strong points: you can pick a time range (2 weeks, 1 month, 1 year…) and see how any measurement has evolved. I’ve used this, for example, to try to correlate wind direction with fine-particle levels — without finding a really clear correlation, to be honest. Weatherlink also lets you export data and generate monthly NOAA-format reports as PDFs, handy for archiving or republishing elsewhere.
Another nice feature: a map of nearby Davis Instruments stations. There aren’t many in Brittany (one near Quimperlé, another near Pont-l’Abbé, one on Belle-Île), whereas you find a lot more in the UK or northern Italy.
On data resolution: the free account consolidates readings every 15 minutes. To get down to 5 minutes, you need the Pro subscription, around €40 a year — something I opted for, though it’s clearly not essential for occasional use.
The Weatherlink iPhone app shows exactly the same data as the website, in a very polished presentation: a daily summary, 7-day and hourly forecasts, graphs for temperature, rainfall, wind with compass, UV (with its risk scale), and solar radiation — this last one interests me in particular, since it lets me compare actual sunshine against my solar panels’ output. All of it available on the go, without needing to open a computer.
After 3 years
A station that hasn’t moved an inch despite the storms, flawless radio reception despite a concrete slab in the way, and data that keeps flowing without interruption. The only real maintenance is the occasional rain-gauge cleaning. For anyone who wants to track their local weather seriously — and possibly cross-reference it with a solar installation, as I do — the Vantage Pro 2 more than delivers.
For the details of the local setup (WeeWX, the Belchertown skin, publishing to Wunderground, PWS Weather, Météo Bretagne…), see Weather observations with the Vantage Pro 2 station.